3 minutes
Scraping application specific metrics using prometheus which is protected by API key or basic auth.
If you are using prometheus you know, in order for prometheus to scrape metrics from endpoint you would need to defined scraping job. Nowadays, people write custom exporters to expose metrics to get more detailed information about how application is performing. For such case we add that application endpoint as prometheus job and let prometheus scrape it. But sometime those endpoints are protected using either basic auth ( username and password ) or using API keys in which case you would need add those creds as well.
First of all, make sure your application is configured to expose metrics at certain endpoint. This depends on how developer has implemented. I like to follow the standard and configure application to expose metrics at /metrics endpoint as a industry standard.
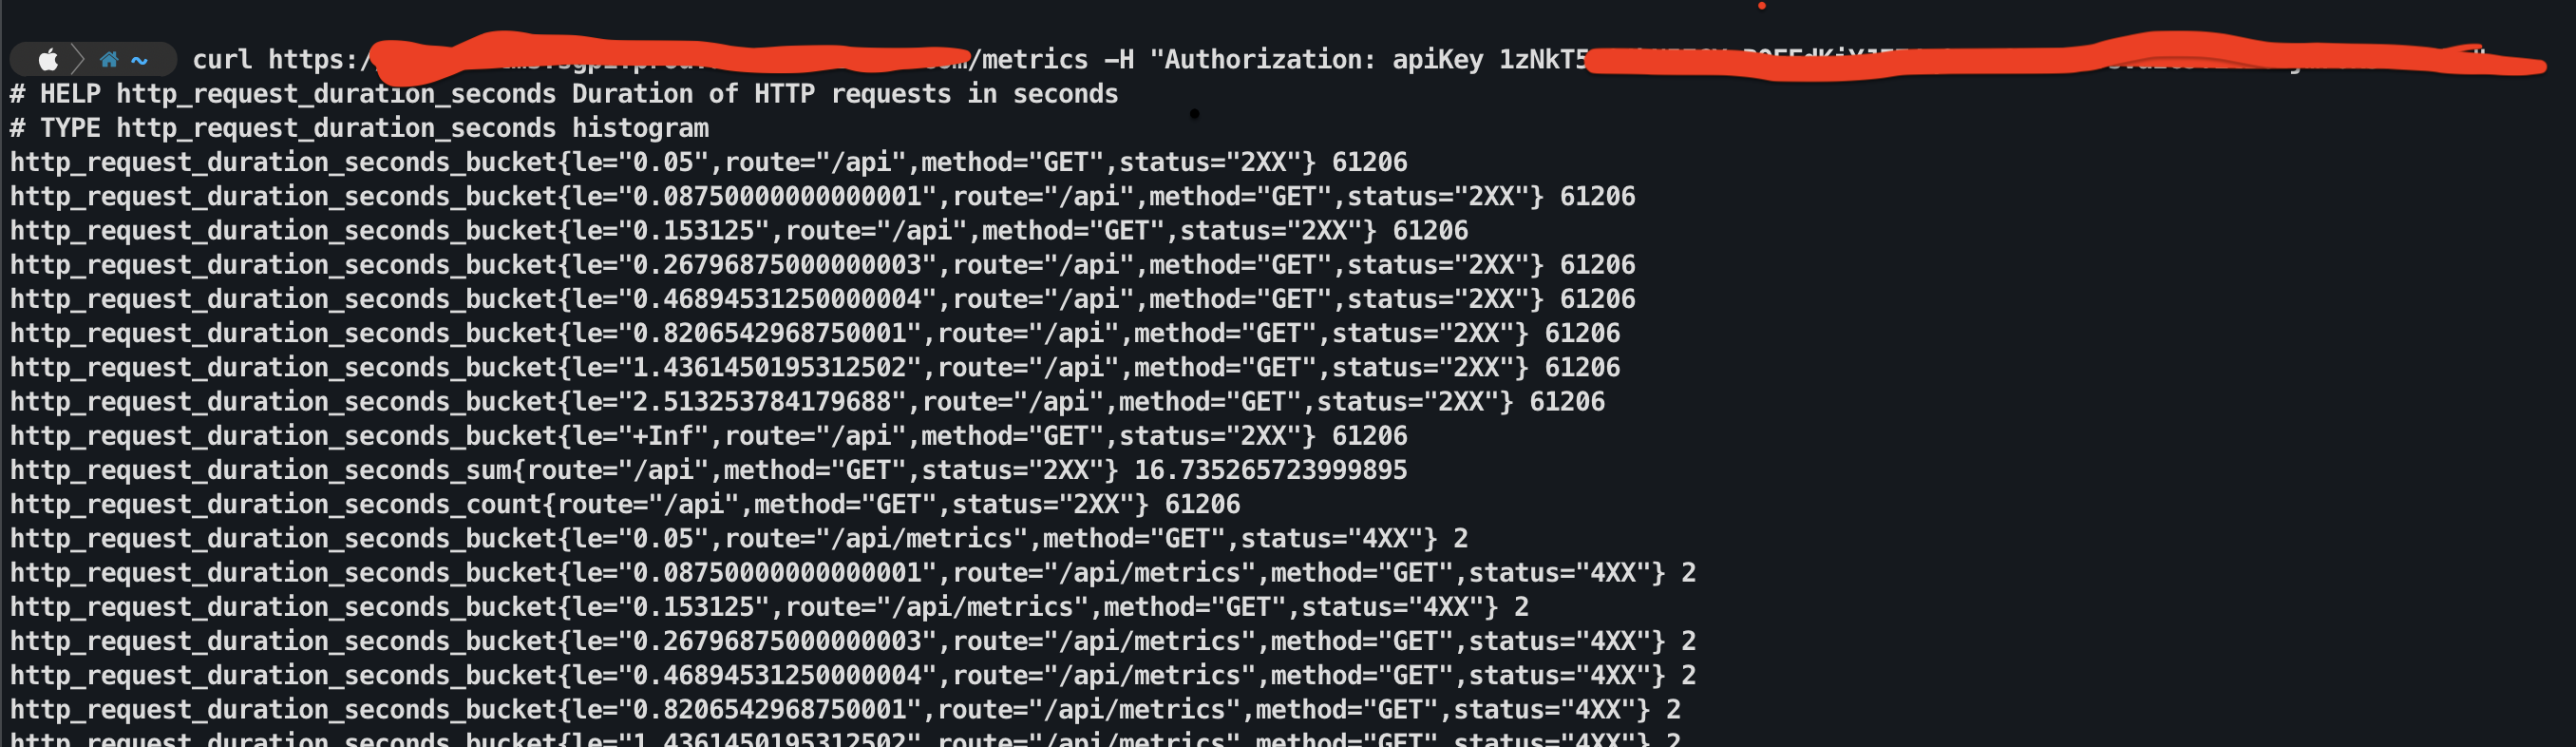
Once configured you can verify this using curl
Once that is done and tested we can scrape custom application metrics exposed by application using in kubernetes using following ways
Note: I am using kubernetes service DNS name instead of external facing DNS name. If your application is not hosted on kubernetes, you can use external facing DNS names. Make sure prometheus can reach the application endpoint.
If the API endpoint is protected using basic auth i.e user/pass
  - job_name: web-service
    honor_labels: true
    static_configs:
      - targets: ['web.app-dev.svc.cluster.local:80']
    basic_aith:
      username: <USERNAME>
      PASSWORD: <BCRYPTED_PASSWORD>
Note the BCRYPTED_PASSWORD, make sure password is encrypted before committing to source control either using bcrypt or other methods of your choice.
You can use following python snippet to conver your password to bcrypt format
python3 -c 'import bcrypt; print(bcrypt.hashpw(b"PLAIN_PASSWORD", bcrypt.gensalt(rounds=15)).decode("ascii"))'
Is bcrypted password secure to be kept in source control? You might ask. Yes, bcrypt password uses one way hash function to get the hashed value. IMHO, it is way better than storing it as plain text. For more reading: https://codahale.com/how-to-safely-store-a-password/ but if you are paranoid, you can manage using other secret manager as well.
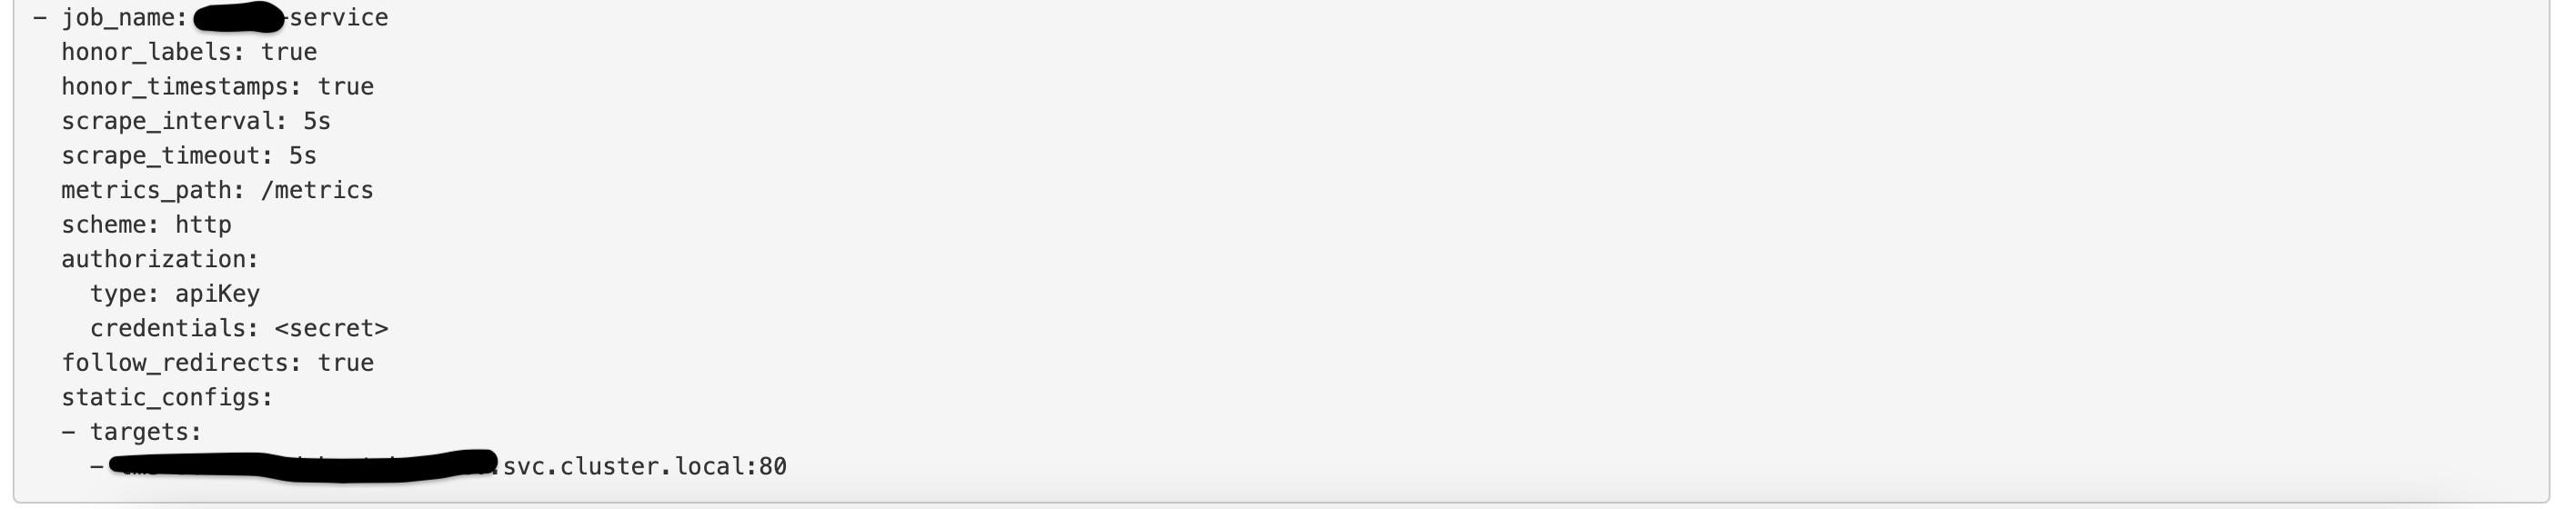
If the API endpoint is protected using API key
  - job_name: web-service
    honor_labels: true
    static_configs:
      - targets: ['web.app.svc.cluster.local:80']
    authorization:
      type: apiKey
      credentials: "{{ web_service_api_key }}"
Note: apiKey type defined above is case sensitive i.e. for example if you do a curl with -H Authorization: apikey XXXXX is different to -H Authorization: apikey XXXXX where in later one i am using type: apikey. Here thing to note is the apiKey vs apikey. Hence make sure you are defining type as same as what’s defined in the application authentication code. My application code has defined as apiKey hence i am using this type in prometheus configuration.
One small caveat over here is API creds cannot be hashed and bcrypted. That is a bit bugger and hence you would need to find some other options to encrypt the api keys. For my case, i am using ansible for promethues configuration / deployment, and ansible provides nice way to encrypt creds in ansible-vault and reference it using jinja variable. You can use other ways as well like AWS secret manager or Hashicorp vault etc.
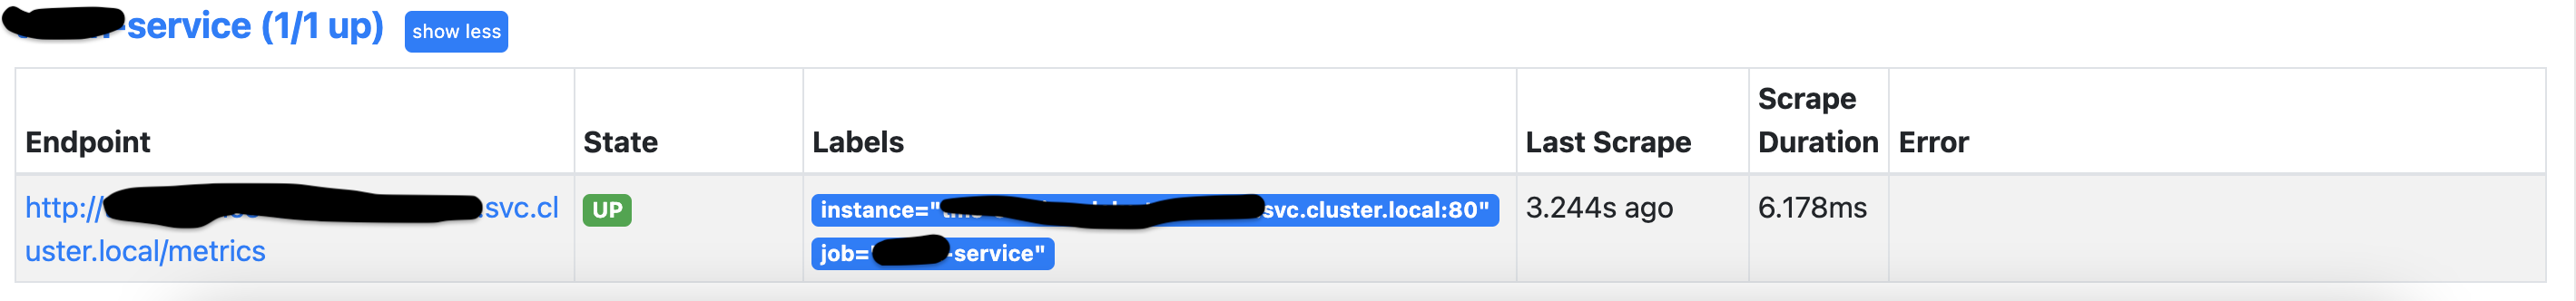
Once configuration has been applied, you can go to prometheus > targets and see if your job that you created is ok and is being pulled. You should be seeing something like this
You can also test if the configuration is there
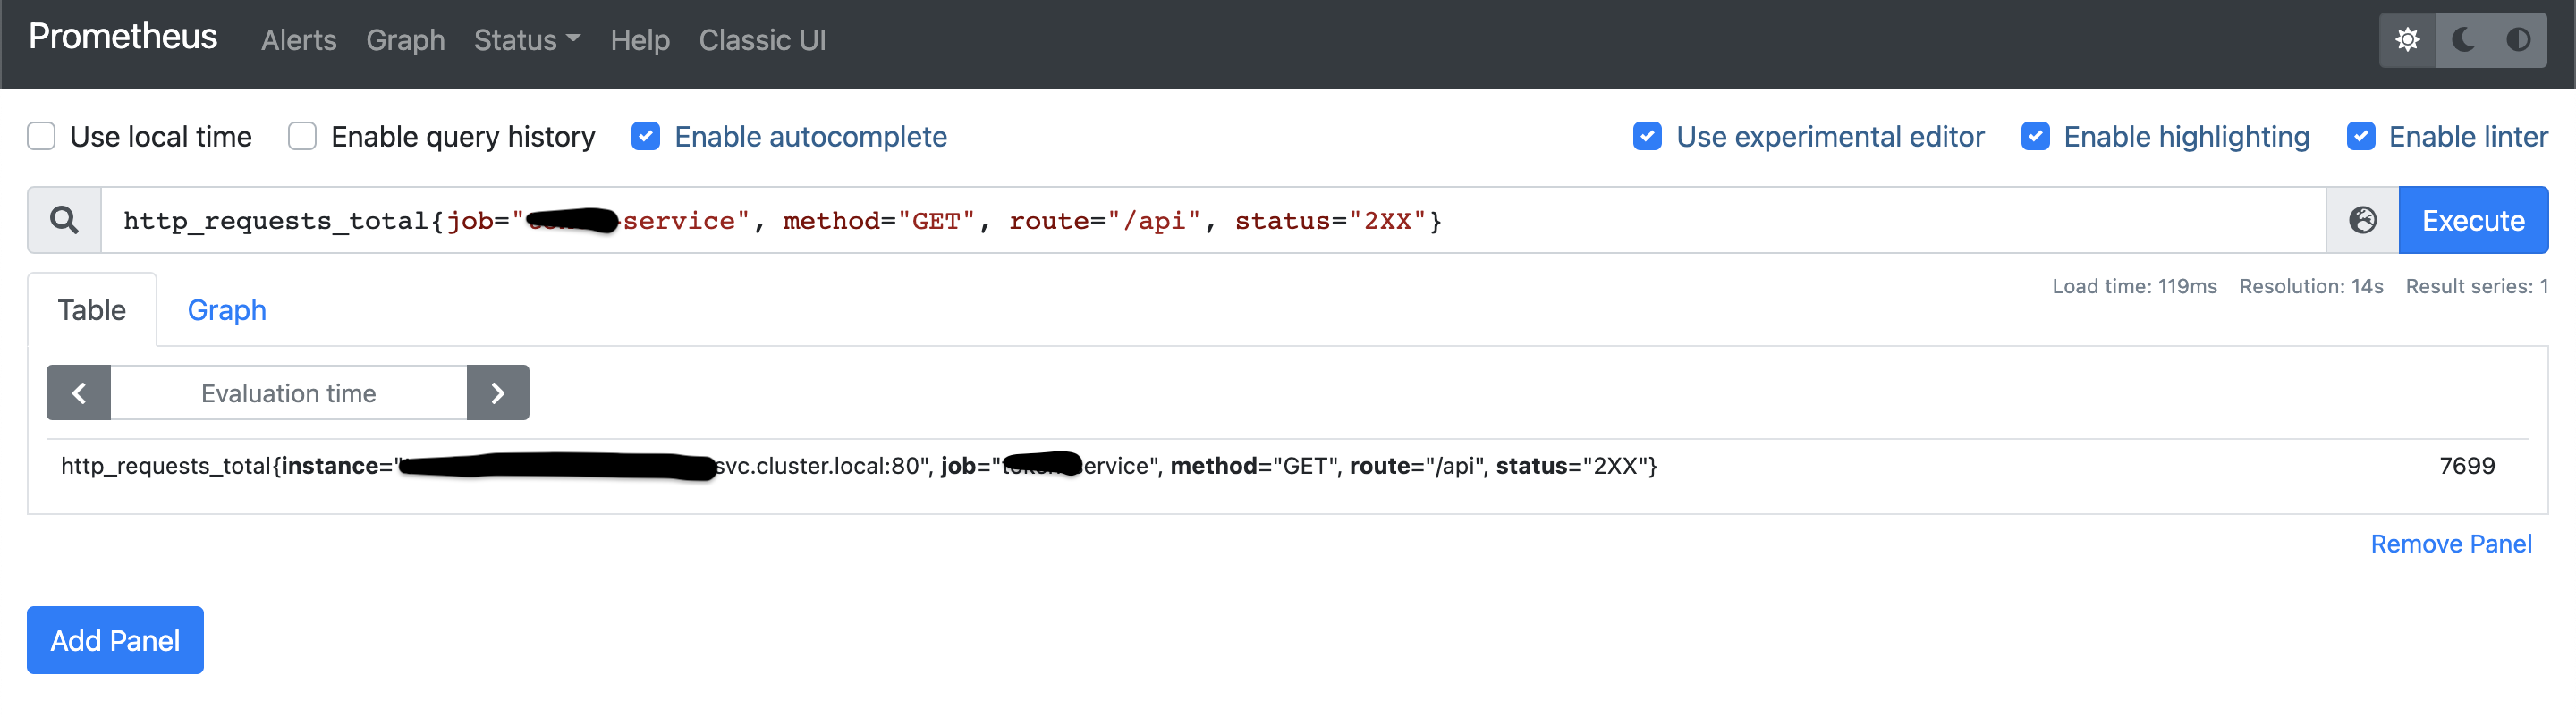
Once all of these is done, see if metrics are coming through, which is something like this
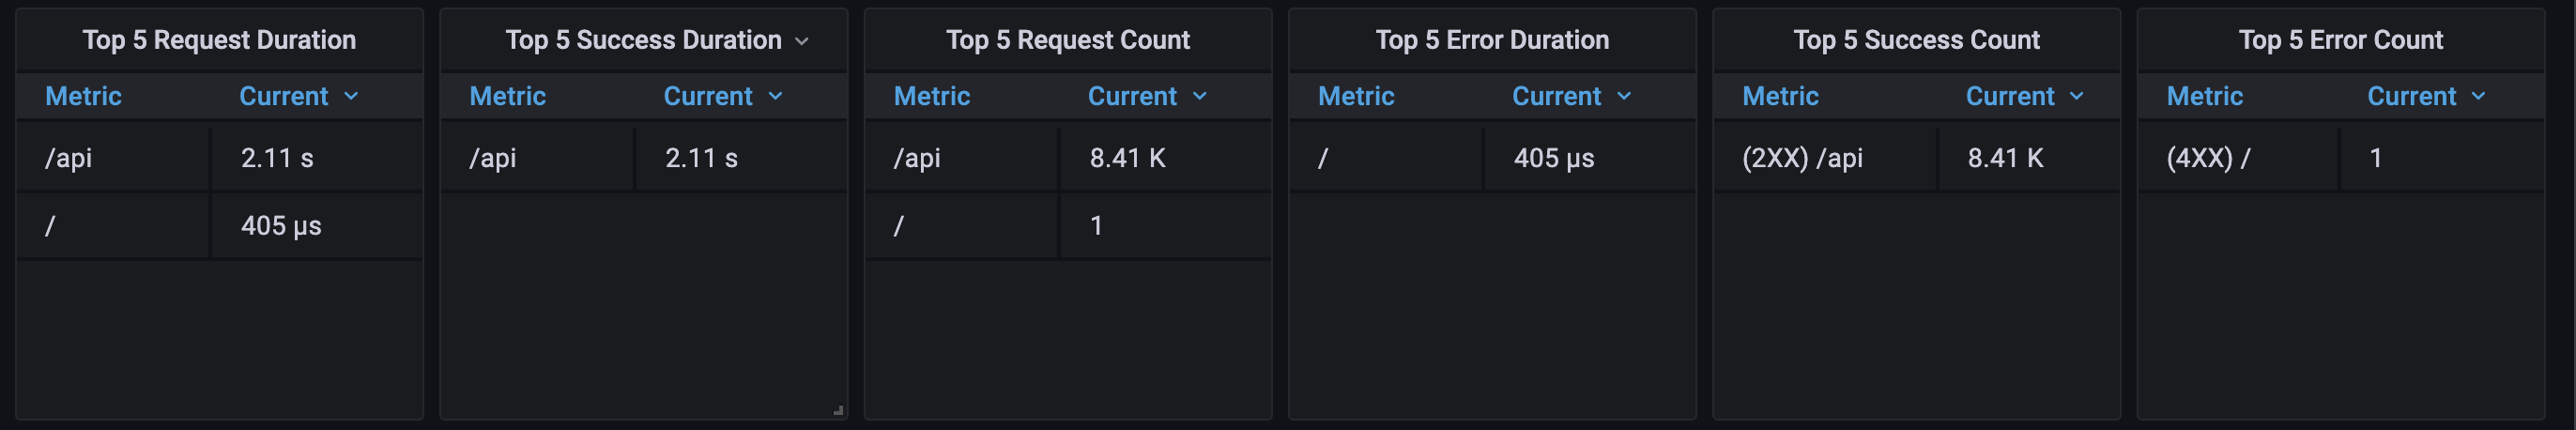
Now, the only thing you would need to do is hook it put to a dashboarding service like Grafana and you are good to go. Something like this
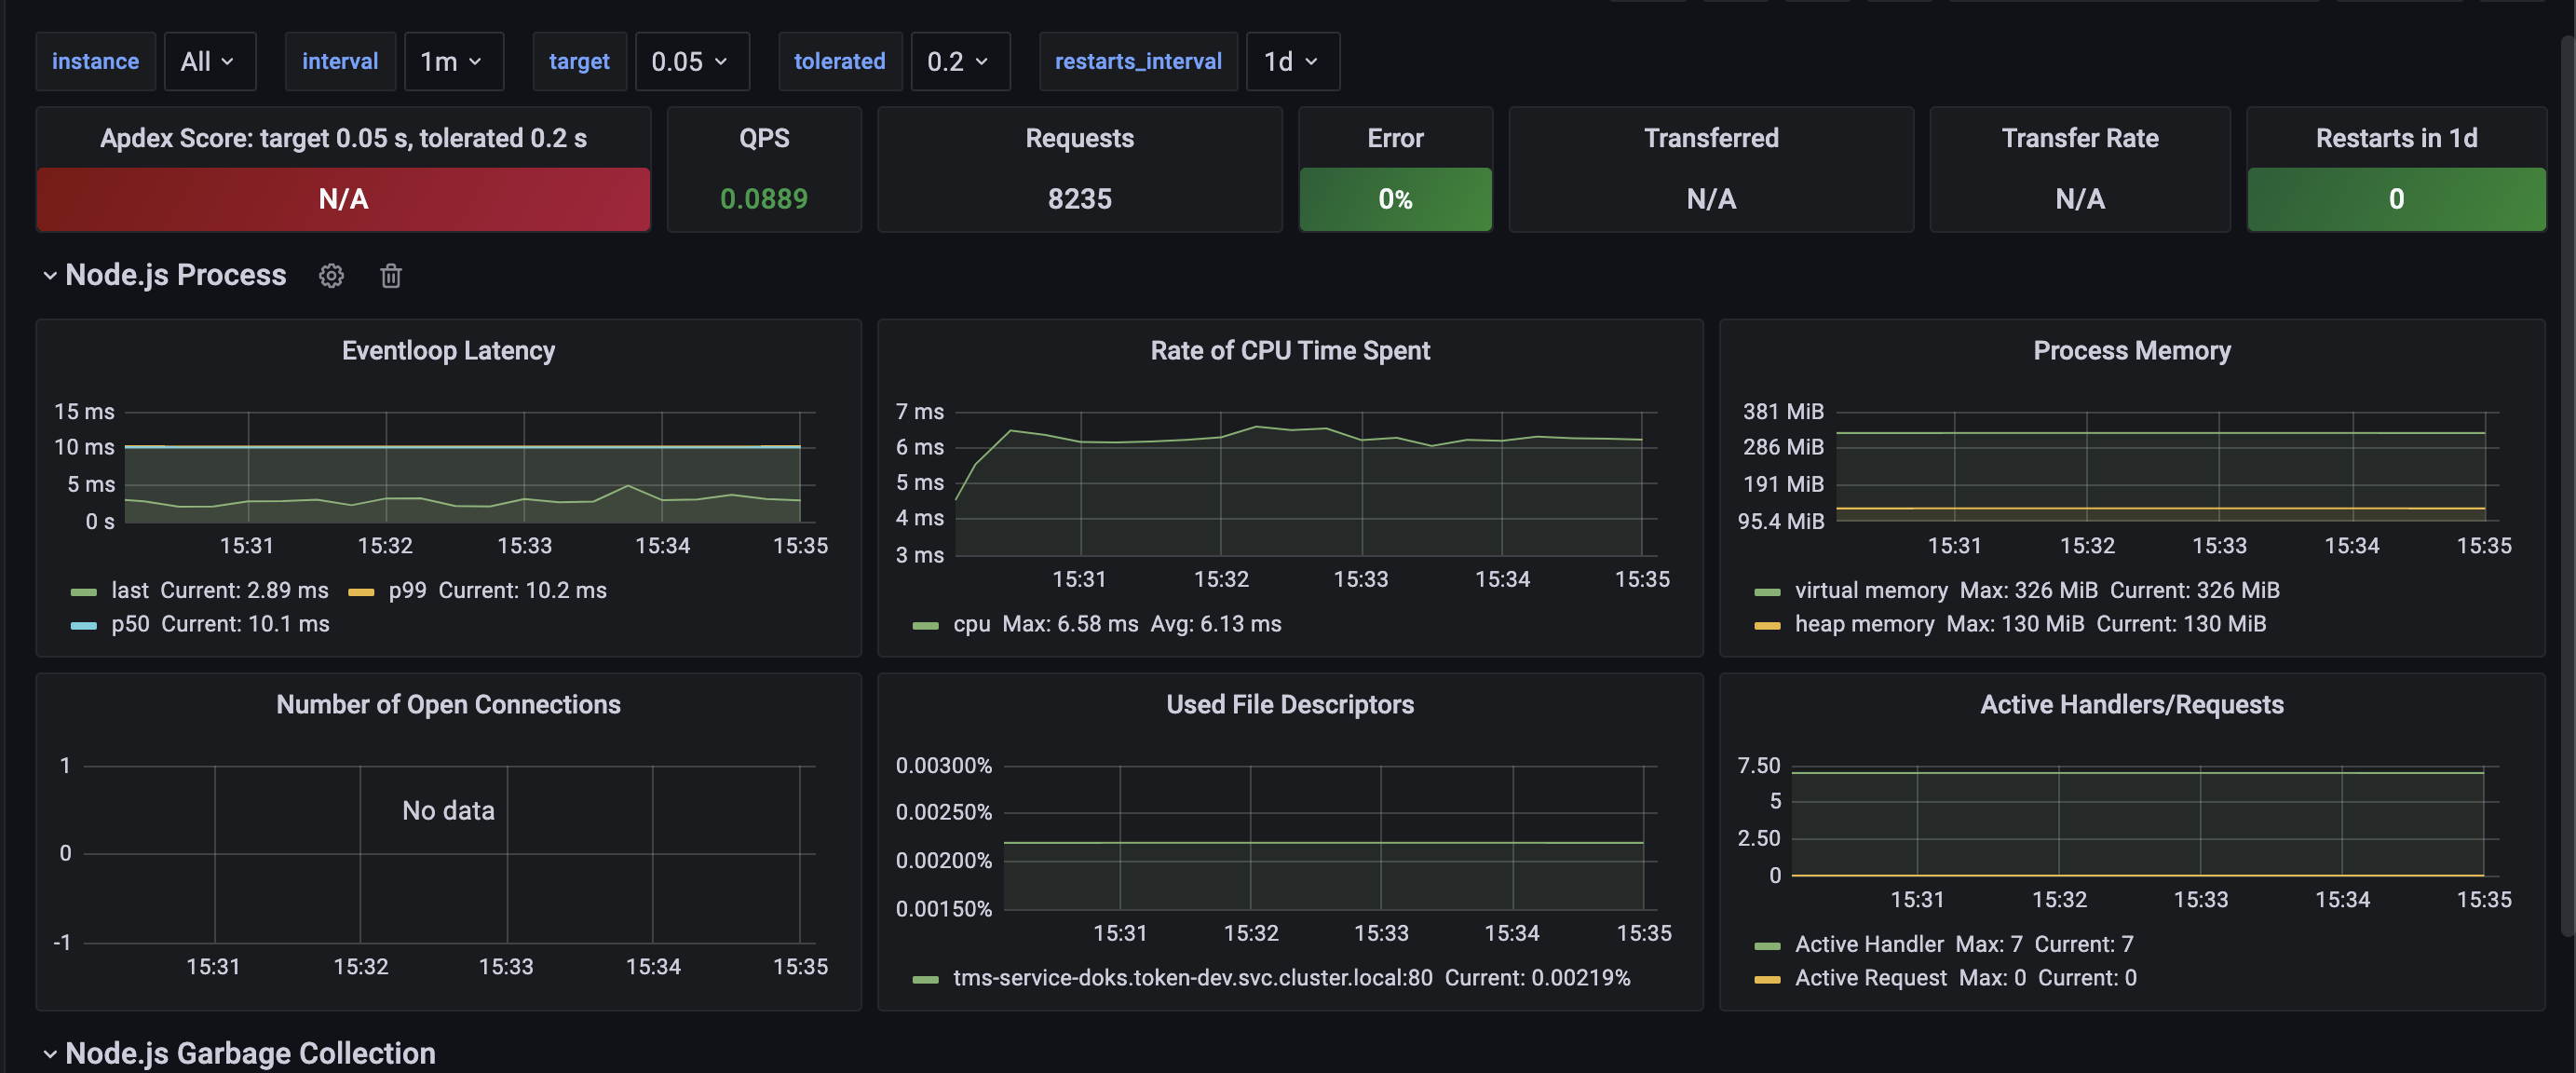
If you fancy, you could tweak the metrics and produce some fancy looking charts as well like this