5 minutes
Are you are just hoarding useless data like garbage? A short descriptive intro on selective monitoring.
Before we begin, I would like to thank my colleague Dr. Luke Mondy who had been very helpful in investigating and implementing selective monitoring using Prometheus.
So, let’s begin, the problem with using monitoring and visualization tool is that they expose tons and tons of metrics. On average a system running node exporters and cAdvisor exposes around ~ 50K metrics active series of data from a node, applications, process, containers, and many more.
Having visualization of your data is good, I am not saying it’s bad, but let’s be honest here. People import all the data hoping some random dashboard on the internet would work and make their life easy.
Here is a public dashboard from Node exporter when it exposes all the metrics from the server.
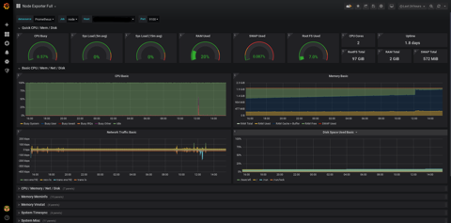
This image is from the first row. There are 14 more rows below with about 90+ panels on them which you will never look at again.
I mean, to be honest, let me ask you how many times did you have looked into that dashboard and left by just checking memory usage, CPU usage, and disk space?
You might have done that because only those data were important, you do not care about. You do not care about how the node is throttling cooling or scheduled time slices executed by each CPU or interrupt detail or CPU time spent on user and kernel space.
Don’t get me wrong here, if you are a performance engineer, these things are one of the most important metrics, but for SREs and DevOps perspective, they are not that useful.
We need to selectively pick the metrics that we want to put in front of our eye for monitoring and will create value to organisation.
What is selective monitoring?
Selective monitoring as the name suggests a process where you only take the data which you need and will use it to convert it into information. As I like to call it “Data not used is just garbage being collected into your system.” In an ideal world, you would only collect the data you need and display it to be meaningful. But the world is not ideal hence better approach would be to collect all the data but display only the information which is valuable.
This would give you 3 benefit:
- Easier to interpret dashboard with less clutter of information.
- Saves your company some bucks
- But most importantly, you know what metrics you are being sent and how valuable they are to you.
Selective monitoring in Prometheus using DROP and KEEP actions
Prometheus, exporters, and Grafana has become de-facto for monitoring systems, application, and services. Here are some ways you can strip down the metrics being sent to SaaS-based visualization services and avoid sending unused and unmeaningful data.
Prometheus provides a neat feature that you can use to select the metrics using regex and apply actions of keeping or dropping them. You can discard data by using drop action or keep using keep the action on your Prometheus configuration
              metric_relabel_configs:
              - source_labels: [ __name__ ]
                regex: go_(.+)
                action: drop
              - action: drop
                regex: (.+)_bucket
                source_labels: [ __name__ ]
And another using keep action
              job_name: default/node-exporter
              kubernetes_sd_configs:
                - role: pod
                  namespaces:
                    names:
                      - NAMESPACE
              relabel_configs:
                - action: keep
                  regex: node_time_seconds|node_boot_time_seconds|node_cpu_seconds_total|node_memory_MemTotal_bytes|node_cpu_seconds_total

                  source_labels:
                    - __name__
A Case study on how we implemented selective monitoring?
Grafana offers a cloud-based SaaS solution for collecting metrics and visualization. That is cool, you do not have to maintain all those Prometheus and Grafana. But there is a caveat here.
- You are vendor locked in
- You are sending data, which means it is costing you money.
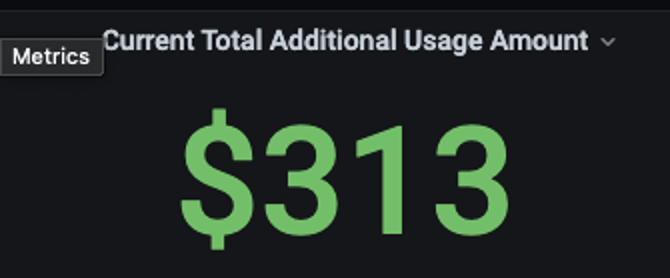
Grafana cloud offers no additional cost for around ~15k active series data and if you go beyond that, they start charging you for all the additional amount of data. They charge $16/month for 1000 series. This might look insignificant at first, we also thought the same, then we fired up node exporter and cAdvisor metrics from one of our k8s cluster and started sending metrics over.
After a couple of days, we realized that it was showing, we were about to be billed ~$300 for all the additional cost. Working in an enterprise such an amount is insignificant, but still, we wanted to see why we were getting billed that much but not just $49 instead.
Then we looked at the metrics being sent over. This was where we got overwhelmed, we were sending ~50K series to Grafana cloud. This would have been okay if we know what we want to do with all those data but to be honest, no one cares about the dashboard nowadays unless you get an alert stating something is broken. Here is an image of those data.
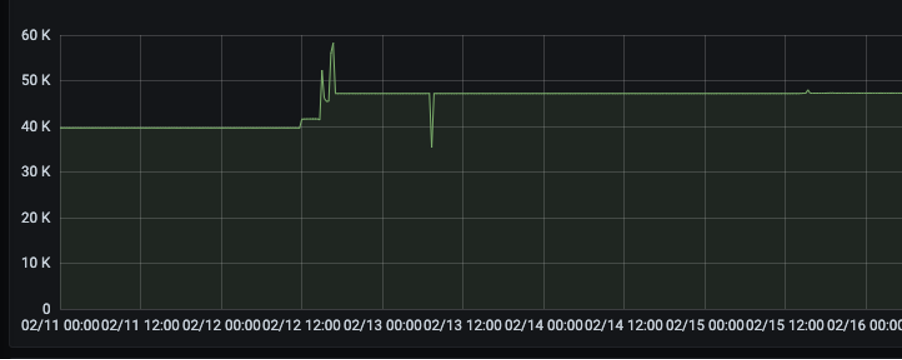
This was near about three times more than the intended use. We started to look further at what data we needed using selective monitoring and found that Kubernetes was sending some “go_*” metrics which we did not have any idea, nor we cared atm. Node exporter was also sending heaps of data. Hence, we decided to dump them all and keep only the data that we needed.
I like a good dashboard, but as you saw a community-provided node exporter dashboard above on Grafana. It is a maze. Looking at that dashboard, I get more scared than the system metrics.
So, back again, we dumped the data and kept only the ones that we needed and then this happened.
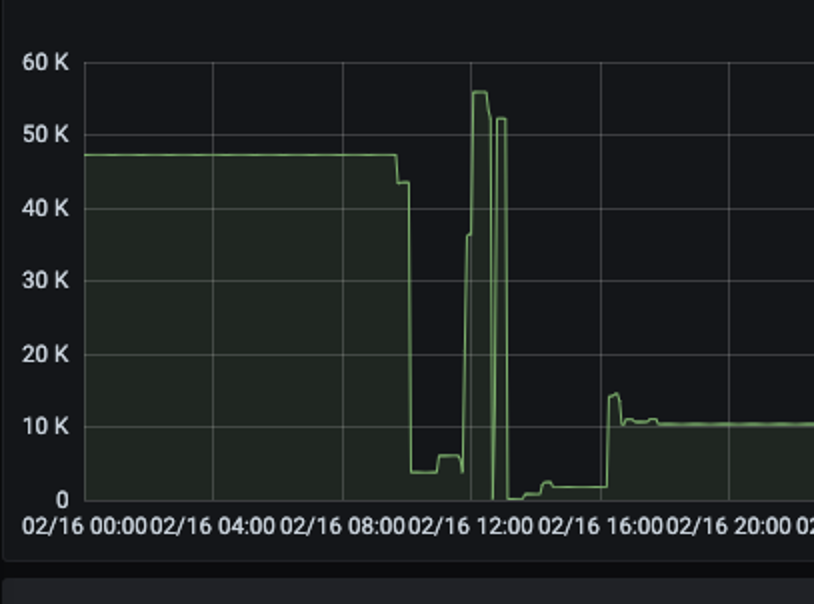
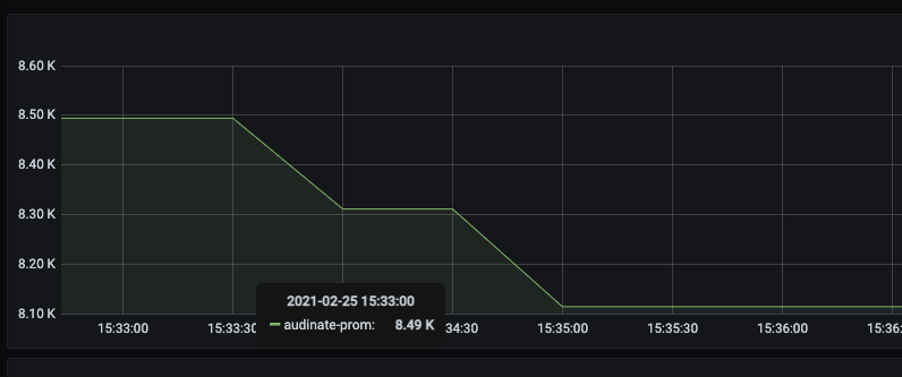
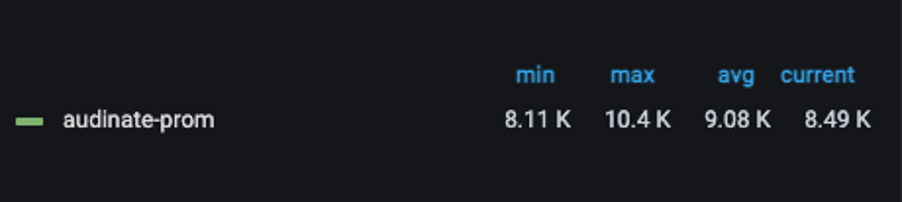
We were now sending only 10k metrics over to Grafana cloud which was now under our enterprise plan without additional cost. But we did not stop at this, we looked further and trimmed down only the data we needed and again this happened.
Now we were sending only 8.2k metrics with only the information that was needed as seen from the image below.
You might be thinking with all those data trimmed off, did you managed to have a good dashboard?
Yes, we did with 0 additional costs.
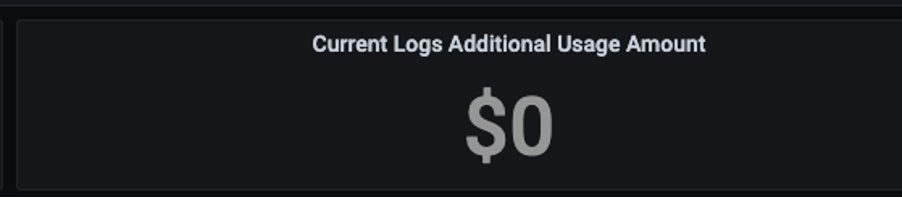
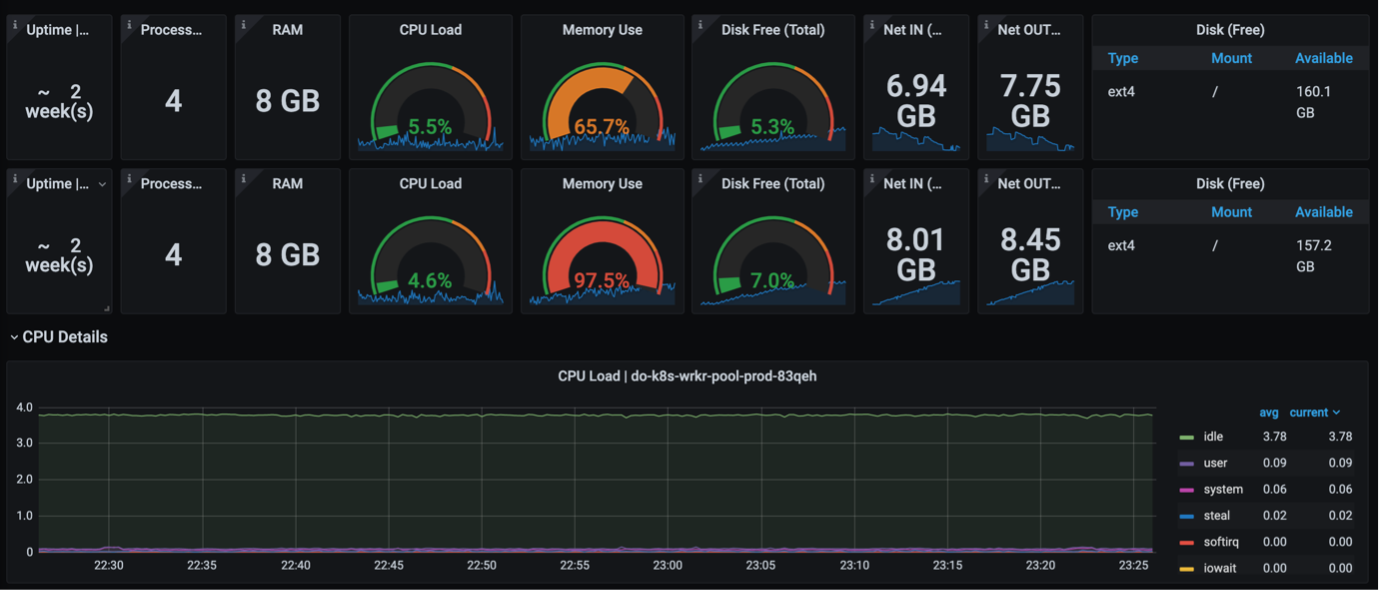
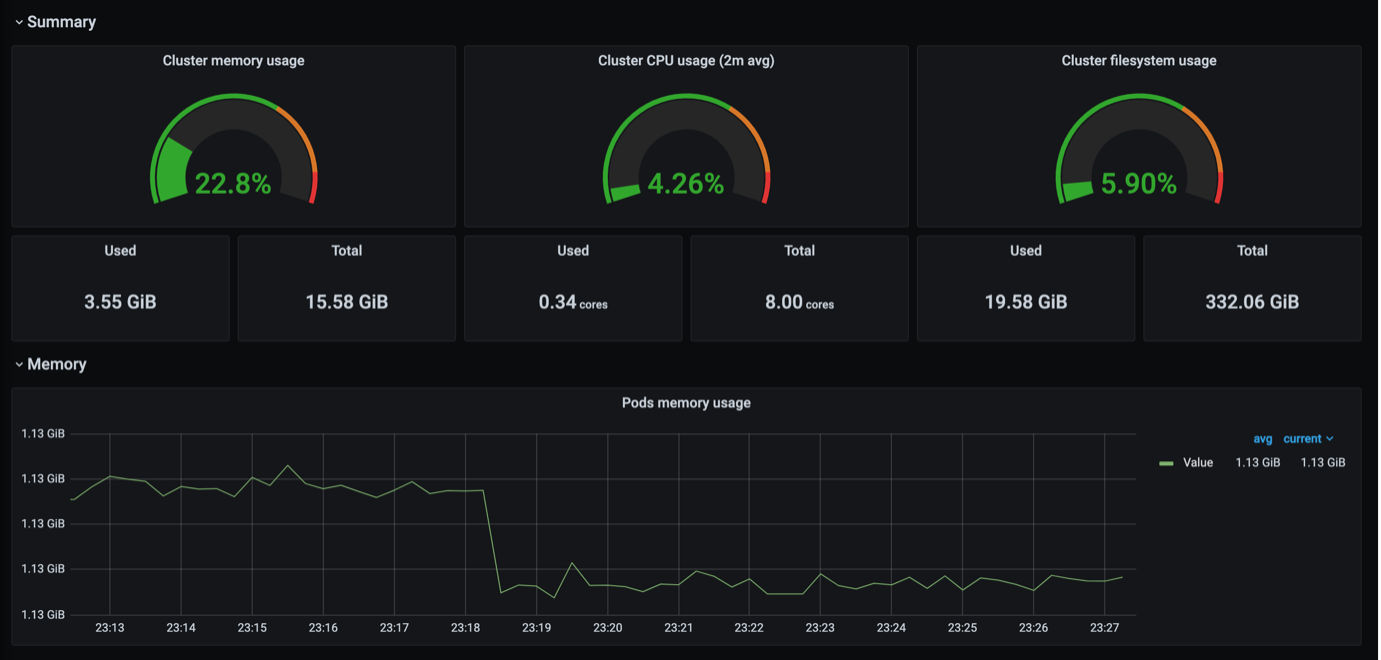
Here are some dashboards with only the information that we needed.
Conclusion
To end this article, it is a good practice to visualize only the things you would want to keep an eye on because data not used, is garbage data collected.