3 minutes
Why is the total memory use of my Kubernetes worker node always above 90%?

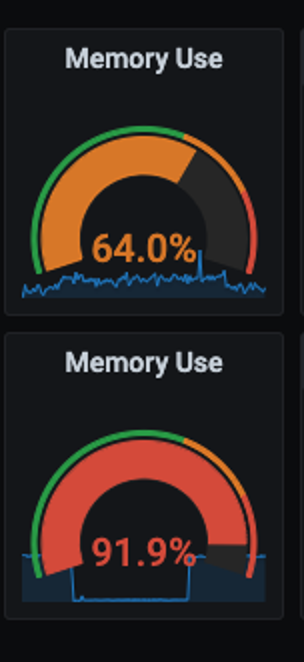
Are you scared that memory use of your Kubernetes node going above 85% all the time
then don’t worry, its normal.
The above picture might have startled you at first but don’t worry, we will discuss why that is perfectly normal and even good. Let’s see what is the difference between free and available memory?
What is Free memory?
A Free memory is the memory that is not currently in used by anything. Free memory should be as small as it can be as memory not in used in memory wasted.
What is available memory?
Available memory is the amount of memory on standby and is available for allocation to a new process or to existing processes.
Now we have the definition out of the picture, let’s see why less free memory having is better.
Why less is better ?
Most of the operating system tend to keep as low free memory as possible. This is because the cost of using free memory is higher than memory in use. Why?
Because a memory which is in not in use by a process needs to first to change from free memory to in use memory then can be used by process, where as a process in use just needs to switch context. The memory which is in use and is available but not free can be easily switched to another use. This is the reason having Free memory is costly due to extra step of switching memory from free to in use state.
Now, you might feel a bit confident and calm now that having less free memory in your system is good
But make sure available memory is not less. If the available memory goes over then your system would start swapping the pages to the disk which would introduce page faults. Be careful of that. If your system has less available memory, then you might want to vertically scale your system or horizontally scale and balance the load.
Here is the example of a healthy system.
free -m

               total        used        free      shared  buff/cache   available
Mem:           7892        2645         234         159        4512          4817
Swap:          7935        3183        4752
Here is another system which is healthy

If you measure nodes in Kubernetes using node-exporter daemon, then you will see the memory usage of the node is very high. This is actually good; your cluster is working to its full potential.
You need to be worried when you cluster has less available memory.
Here is a gauge graph from k8s cluster with high memory usage.

You can see the memory usage is high. This is good. But make sure, your available memory is sufficient and has not been used up.
For the same cluster if you see the actual memory available in each nodes then you can see that there is enough memory in the node.
kubectl top node

NAME                          CPU(cores)   CPU%   MEMORY(bytes)   MEMORY%
do-k8s-wrkr-pool-prod-83qeh   212m         5%     1805Mi          26%
do-k8s-wrkr-pool-prod-83qek   171m         4%     1797Mi          26%